Platform Capabilities

Every Tool You Need, Nothing You Don't

Astrais Capital brings together portfolio management, market analytics, investment screening, risk evaluation, and automated reporting in one unified platform built for clarity, speed, and reliability.

Portfolio Dashboard

Your Complete Financial Picture in One View

The Astrais portfolio dashboard centralizes your entire investment landscape. Instead of switching between multiple apps and spreadsheets, you get a single source of truth for all your holdings. Every data point refreshes automatically, so the numbers you see always reflect current market conditions. The layout adapts to your screen size and personal preferences, allowing you to create a workspace that fits your decision-making style rather than forcing you into a rigid template.

Automatic Account Syncing

Connect your brokerage accounts securely through read-only API connections. Positions, transactions, and balances update without manual input, saving you time and reducing the risk of data entry errors. Support for over 300 financial institutions across North America and Europe.

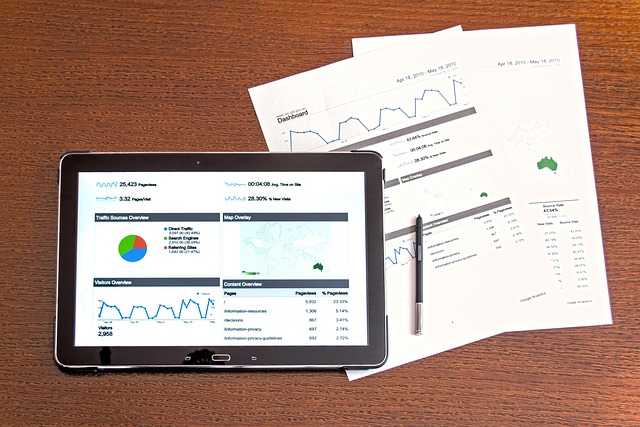
Visual Allocation Breakdown

Interactive donut and treemap charts show exactly how your capital is distributed across asset classes, sectors, geographies, and individual positions. Hover over any segment to see precise dollar amounts and percentage weights, helping you identify concentration risks at a glance.

Customizable Data Tables

Choose which columns to display: cost basis, market value, unrealized gain/loss, dividend yield, daily change, and dozens more. Sort by any column, filter by tags you assign, and export filtered views to CSV for external analysis or record-keeping.

Manual Holdings Support

Not everything connects via API. Add private equity stakes, real estate holdings, collectibles, or any custom asset manually. Track their estimated values over time to maintain a comprehensive view of your total net worth alongside publicly traded positions.

Astrais portfolio dashboard showing asset allocation charts, holdings table, and performance summary
+$14,280
Today's gain
Interactive candlestick chart with technical indicator overlays including MACD, RSI, and Bollinger Bands
RSI Divergence
Signal detected
Market Analysis

Professional-Grade Charting and Data

Our market analysis engine processes real-time feeds from over 60 global exchanges and delivers them through an intuitive charting interface that scales from quick glances to deep technical research sessions. Whether you study price action with candlestick patterns or rely on momentum oscillators to time entries, the tools adapt to your methodology without requiring a steep learning curve.

50+ Technical Indicators

Moving averages, MACD, RSI, Bollinger Bands, Stochastic, Ichimoku, and many more available as chart overlays.

Multi-Timeframe Views

Switch from 1-minute intraday candles to monthly charts. Compare timeframes side by side to confirm trend alignment.

Drawing Tools

Trendlines, Fibonacci retracements, channels, support and resistance zones. All annotations save automatically.

Comparison Charts

Overlay multiple securities on a single chart to visualize relative performance and spot correlation patterns.

Beyond charting, our analysis tools include a market overview page with real-time sector heat maps, a global economic calendar tracking earnings dates and macroeconomic releases, and a correlation matrix that reveals how your positions relate to one another under various market conditions. Each tool is designed to reduce research time while maintaining the depth that serious investors require.

Investment Discovery

Find Opportunities That Match Your Strategy

Sifting through thousands of securities to find ones worth your attention used to require expensive terminal subscriptions and hours of manual filtering. Our investment screener brings that capability to a clean, accessible interface that anyone can use. Define what matters to you, and the system surfaces only the instruments that pass your criteria.

Custom Screening Parameters

Filter by market capitalization, price-to-earnings ratio, dividend yield, revenue growth, debt-to-equity ratio, sector, geography, and dozens of other fundamental and technical metrics. Combine multiple conditions using AND/OR logic to build screens that precisely match your investment thesis.

Detailed Fact Sheets

Every screened security comes with a comprehensive fact sheet that includes key financial statements, analyst consensus estimates, peer group comparisons, historical price data, and recent news mentions. All the context you need to evaluate an opportunity lives on a single, scrollable page.

Watchlists and Saved Searches

Save your screening criteria to rerun later with fresh data. Add promising finds to organized watchlists with custom labels. Receive notifications when new securities meet your saved screen criteria, so you never miss an emerging opportunity.

Trending and Sector Momentum

A curated section highlights securities experiencing unusual volume, price momentum shifts, or earnings surprises. Sector-level momentum rankings show where broad capital flows are directed, giving you a macro lens to complement your bottom-up research.

Investment screening tool displaying filtered results with fundamental data columns and sector breakdown
23 Matches
Growth screen
Risk assessment dashboard showing portfolio stress test results, drawdown chart, and exposure heat map
VaR: $8,420
95% confidence
Risk Assessment

Understand and Manage Your Exposure

Knowing your return is only half the equation. Understanding the risk behind those returns separates informed investors from speculative ones. Our risk assessment module quantifies your portfolio exposure through established financial models, making abstract risk concepts tangible and actionable through clear metrics and visual representations.

Value at Risk (VaR)

Calculate the maximum expected loss over a specified time horizon at a given confidence level. Our VaR engine uses historical simulation, parametric models, and Monte Carlo methods, letting you choose the approach that best suits your portfolio characteristics and risk philosophy.

Stress Testing

Simulate how your portfolio would perform under historical crisis scenarios such as the 2008 financial crisis, the 2020 pandemic selloff, or rising interest rate environments. You can also create custom scenarios by defining hypothetical market shocks to sectors, rates, or currencies.

Correlation Matrix

Visualize how your positions move relative to each other. A color-coded matrix reveals which holdings provide genuine diversification and which ones tend to move together during market stress. This insight helps you avoid the false sense of safety that comes from owning many securities that all respond to the same underlying factors.

Rebalancing Suggestions

When your portfolio drifts beyond your target allocation due to market movements, the system generates specific rebalancing suggestions showing which positions to trim or add to, along with the estimated impact on your risk profile. These suggestions are informational tools, not trade instructions.

Smart Alerts

Stay Informed Without the Noise

Traditional price alerts flood you with notifications every time a threshold is crossed, even if the movement is meaningless in context. Astrais smart alerts let you define multi-condition triggers that only fire when genuinely relevant events align, dramatically reducing notification fatigue while ensuring you never miss something important.

Price Threshold Alerts

Set alerts when a security crosses above or below specific price points. Useful for tracking entry targets, stop-loss levels, or resistance breakouts. Alerts persist until triggered and can be configured to fire once or every time the condition is met within a defined period.

Volume Spike Detection

Receive notifications when trading volume on a watched security exceeds a multiple of its average daily volume. Unusual volume often precedes significant price movements, and catching these spikes early gives you time to research the catalyst before the broader market reacts.

Multi-Condition Triggers

Combine up to five conditions into a single alert. For example, trigger only when a stock drops below its 200-day moving average AND RSI enters oversold territory AND daily volume exceeds twice its average. This precision filtering eliminates false signals.

Earnings and Event Reminders

Automatically get reminded before earnings announcements, ex-dividend dates, and major economic releases that affect your holdings. Configure how far in advance you want to be notified, from 24 hours to two weeks before the event.

Portfolio Drift Alerts

Define your target allocation percentages and set a tolerance band. When any position or sector allocation drifts beyond your specified range due to market movements, you receive a notification along with suggested adjustments to bring things back in line.

Flexible Delivery Channels

Choose how you receive alerts: in-app notifications with persistent badge counts, email summaries grouped by priority, or SMS for urgent triggers. Different alert types can use different channels, so routine updates arrive by email while critical signals reach you by text.

Performance Reports

Comprehensive Reporting That Saves Hours

Measuring performance accurately requires more than simply looking at the current value of your portfolio relative to its starting point. Astrais generates time-weighted and money-weighted return calculations, benchmark comparisons, attribution analysis, and tax-aware summaries that tell you not just how much you gained or lost, but why and where.

Time-Weighted Returns (TWR)

Eliminate the distortion caused by cash flows in and out of your portfolio. TWR isolates pure investment performance, making it suitable for comparing your results against benchmark indices on equal footing.

Benchmark Comparisons

Select from major market indices like the S&P 500, MSCI World, FTSE 100, or DAX 40 to measure your portfolio against. Visual overlays show exactly where and when your strategy outperformed or underperformed the reference benchmark.

Fee Impact Analysis

See exactly how much fees erode your returns over time. The report calculates cumulative fee drag from management fees, transaction costs, and fund expense ratios, presenting both the dollar amount and the compounded opportunity cost.

Automated Monthly Summaries

Receive a professionally formatted report at the end of each month without lifting a finger. The summary covers return attribution, top and bottom performers, allocation changes, and significant market events that affected your portfolio during the period.

Try Reports Free
Performance report showing return attribution chart, benchmark comparison, and monthly summary table
And More

Additional Platform Capabilities

Beyond the core modules, Astrais includes a range of supporting tools that round out the investment management experience.

News Aggregation

Curated financial news feeds filtered to show only articles relevant to your holdings and watchlist. Skip the noise and read what matters to your positions.

Tax-Lot Tracking

Track individual purchase lots with cost basis, holding period, and estimated capital gains. Useful for year-end tax planning and harvesting losses strategically.

Dividend Tracker

Monitor upcoming dividend payments, track yield on cost, and see your cumulative income over time. Calendar view shows payment dates so you can plan cash flow needs.

Multi-Currency Support

Hold assets denominated in different currencies and view everything converted to your base currency using real-time exchange rates. Track currency impact on your returns separately.

API Access

Enterprise plan users can access a RESTful API to pull portfolio data, analytics results, and screening outputs into their own systems, models, or internal dashboards.

Team Collaboration

Invite team members with role-based permissions. Analysts can view data while managers approve report distributions. Shared watchlists and alert configurations keep everyone aligned.

Data Export

Export any dataset to CSV or PDF with a single click. Portfolio snapshots, transaction histories, screening results, and reports are all exportable for offline use or archiving.

Customizable Themes

Choose between dark and light modes, adjust chart color palettes, and configure default views to match your workflow preferences. Your settings sync across all devices.

Plan Comparison

Features by Plan

Every plan includes core portfolio tools. Advanced analytics, unlimited alerts, and team features unlock as you move up.

Feature Starter $0/mo Professional $29/mo Enterprise $99/mo
Portfolio Dashboard Basic Full Full
Watchlist Items 5 Unlimited Unlimited
Smart Alerts 3 Unlimited Unlimited
Technical Indicators 10 50+ 50+
Investment Screener
Risk Assessment
Performance Reports
Team Access
API Access
Priority Support Email Email + Phone
Security & Compliance

Built on Trust and Transparency

Financial data requires the highest standards of protection. Every feature we build starts with security as a foundational requirement, not an afterthought.

AES-256 Encryption

All data encrypted at rest and in transit using military-grade encryption standards. Your information stays protected at every point.

Two-Factor Auth

TOTP-based two-factor authentication available for every account. Add a second layer of protection beyond your password.

SOC 2 Type II

Our infrastructure is independently audited and certified for security, availability, and confidentiality controls.

GDPR Compliant

Full compliance with European data protection regulations including right to access, rectification, and erasure.

Ready to Experience the Full Platform?

Start with our free Starter plan and explore the portfolio dashboard, basic charting, and market summaries. Upgrade to Professional when you need advanced analytics and unlimited alerts.